The Fort Bend Subsidence District Board of Directors approved the District’s 2020 Annual Groundwater Report on Wednesday, May 26, 2021.
The District’s 31st edition of the report covers four main topics: climate data, groundwater use within the District, aquifer water levels, and subsidence rates. Each of these topics are compared to data from previous years in order to provide context on how changes in water use can impact the occurrence and magnitude of subsidence.
“The rise in water-level in the Chicot/Evangeline aquifer as much as 114 feet since 1990 shows the impact of District regulation on the aquifers,” Assistant General Manager Robert Thompson said. “However, we’ve seen drastic declines in northwestern Fort Bend County where conversion to alternatives source of water will not be completed until 2025.”
The District is divided into two regulatory areas that define how much groundwater may be utilized as a percentage of the total water demand. Since 1990, the District has worked with water users in Fort Bend County to switch from primarily groundwater to alternative sources of water in an effort to prevent subsidence.
A Few Key Takeaways:
- On average, climate stations in the region measured precipitation values lower than normal in 2020. This caused a departure from normal precipitation at Sugar Land Regional Airport, TX at nearly 5.8 inches.
- The percent of total water demand sourced from groundwater has dropped from about 60 percent in 1990 to about 49 percent in 2020.
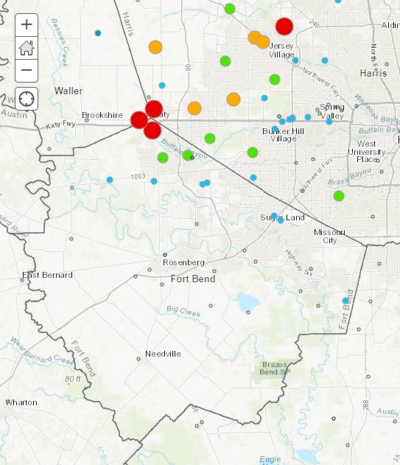
- In northwestern Fort Bend County, water-levels have seen a significant decline of nearly 240 feet in the Chicot/Evangeline aquifer in the Katy/Cinco Ranch area. These areas are growing rapidly and the conversion to alternative sources of water will not be completed in the District until 2025.
- Regulatory Area A has the highest subsidence rates (greater than 1.0 centimeter per year) in the northern and eastern areas of Fort Bend County. GPS station P029, located in Katy, has the greatest subsidence rate estimated at 2.16 cm per year from 2016 to 2020.
“The District’s subsidence monitoring efforts include a GPS network of 26 GPS stations in Fort Bend County, and an extensive network in surrounding counties in partnership with the Harris-Galveston Subsidence District and the University of Houston,” Project Chief Ashley Greuter said.
“The greatest subsidence rates occur in northwest Fort Bend County near the boundary between Harris and Waller counties. Conversely, the southern portion of Regulatory A and all of Regulatory Area B show very little subsidence based on the subsidence rate averaged from 2016 to 2020.”
Currently, wells located in Regulatory Area B have no restrictions on their permits. Groundwater remains the largest source of water supply within the District as a whole.
“Our mission is to prevent future subsidence and mitigate its impacts, such as infrastructure damage and potential flooding impacts,” Mr. Thompson said. “The District gathers this data and creates this report so we can make more informed decisions about groundwater use and aid in building a more resilient community.”
To view the full report and the executive summary, visit the Annual Groundwater Reports section on the Science page on the District’s website.

